Consensus estimates
Below are estimates compiled by Skanska from analysts who regularly follow the company.
| SEK bn | Post 2026 - Q1 |
Post 2025 - Q4 |
Post 2026 - Q1 |
||||||
|---|---|---|---|---|---|---|---|---|---|
| 2026E | 2027E | 2028E | 2026E | 2027E | 2028E | 2026E Change after Q1 report | 2027E Change after Q1 report | 2028E Change after Q1 report |
|
| Revenues (net sales), SEK bn | |||||||||
| Average estimate | 181.3 | 192.0 | 198.0 | 182.8 | 192.0 | 199.0 | -1% | 0% | -1% |
| High estimate | 185.2 | 203.6 | 205.5 | 189.7 | 203.6 | 205.5 | -2% | 0% | 0% |
| Low estimate | 171.1 | 177.2 | 183.9 | 171.2 | 175.6 | 189.4 | 0% | 1% | -3% |
| Operating income (EBIT), SEK bn | |||||||||
| Average estimate | 8.3 | 9.3 | 9.8 | 8.5 | 9.4 | 10.3 | -2% | -1% | -5% |
| High estimate | 8.6 | 11.0 | 11.1 | 9.1 | 11.0 | 11.1 | -5% | 0% | 0% |
| Low estimate | 7.3 | 8.0 | 8.7 | 7.3 | 8.0 | 9.8 | 0% | 1% | -12% |
| EBIT Construction margin, % | |||||||||
| Average estimate | 4.0 | 4.1 | 4.1 | 4.0 | 4.1 | 4.0 | 1% | 1% | 2% |
| High estimate | 4.1 | 4.2 | 4.2 | 4.2 | 4.2 | 4.2 | -3% | -2% | -1% |
| Low estimate | 4.0 | 4.0 | 4.1 | 3.9 | 3.9 | 4.0 | 4% | 4% | 3% |
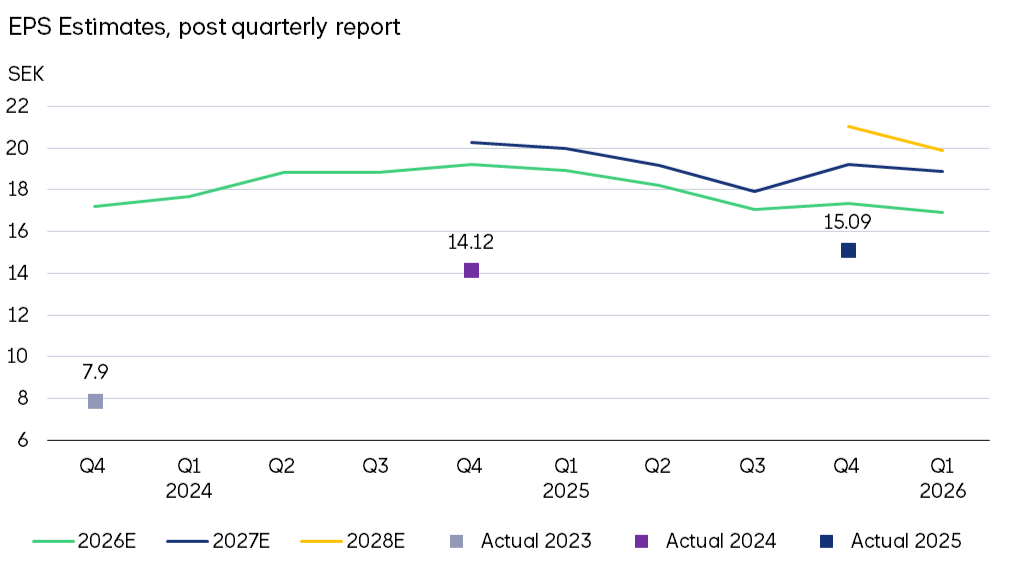
| Earnings per share (EPS), SEK | |||||||||
| Average estimate | 16.9 | 18.9 | 19.9 | 17.4 | 19.2 | 21.0 | -3% | -2% | -5% |
| High estimate | 17.9 | 22.2 | 21.9 | 18.6 | 22.2 | 21.9 | -4% | 0% | 0% |
| Low estimate | 14.5 | 15.2 | 17.0 | 14.4 | 15.6 | 20.0 | 1% | -3% | -15% |